
Amazon seller reports are invaluable to e-commerce businesses. They provide Amazon merchants with the information they need to properly assess their inventory, tweak their product pages and address poor performance. If used properly, it can help sellers adjust pricing and modify the number of products they showcase by identifying trends in consumer behavior.
The reports provide sellers with a wealth of insightful statistics. Despite their usefulness, not all sellers learn about the specific terms Amazon employs for their reports, or how to leverage the metrics.

Don't fall into the trap of just going after reviews, because it's important to get high page engagement as well. Reviews are only one facet of your business and are a bit more illusory than the cold hard facts Amazon Business Reports provide. Hidden in all the stats is the story of your store. It shows you exactly how customers, new and returning, interact with your products, how often they order them and how much of your product they’re willing to order in one fell swoop. In fact, whether you know it or not, these numbers are affecting your product’s rank, possibly even more so than product reviews.
Page Engagement Is More Valuable Than Reviews
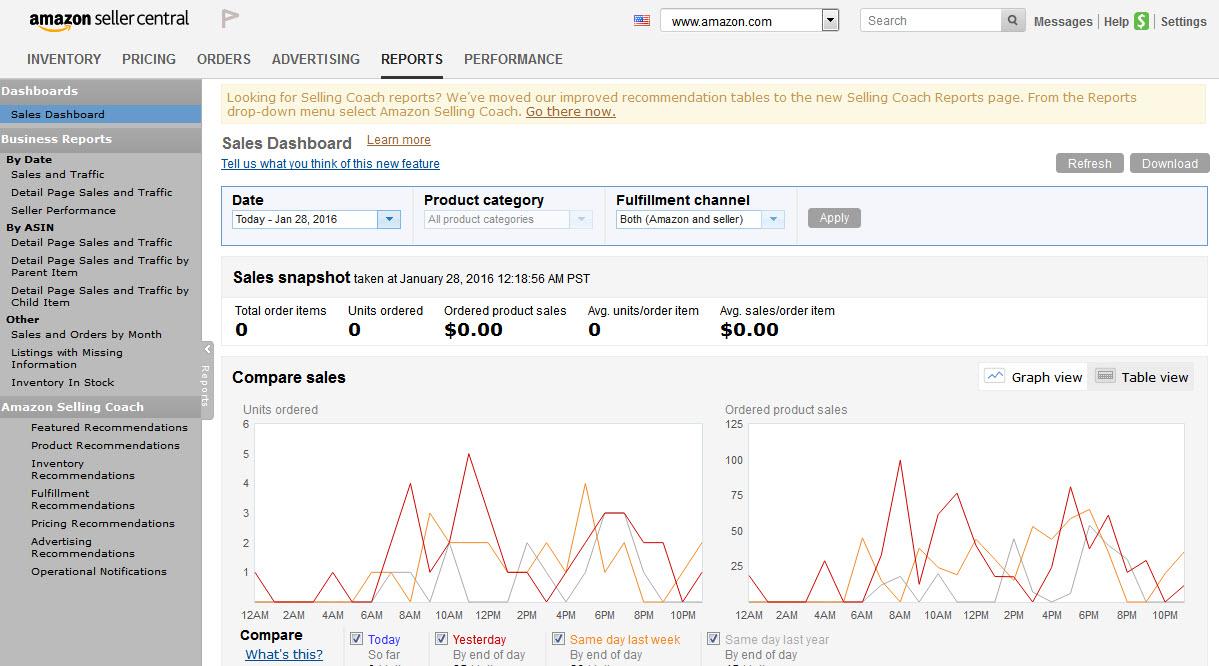
The Sales and Traffic section of Amazon seller reports has an incredible amount of information that can easily illuminate the mysteries of your online shop and your product rankings. The stats indicate how customers are engaging with your product pages and when you’re converting, which can prompt revisions that convert, increase engagement and boost rankings.
Amazon Seller Reports Terms and Definitions
The following metrics appear in the Sales and Traffic section and affect your product ranking. Here is a list of terms and definitions you should know to make the most of your Amazon reports.
Ordered Product Sales
This is your item price multiplied by the units ordered. This metric shows the sales produced by the item itself.
Gross Product Sales
Your gross product sales is calculated by adding your product sales, your ordered gift wrap amount and ordered shipping amount. Think of this as the total amount of money customers have spent on your product, including fees outside the product itself. Amazon bases a large amount of your product’s ranking on the revenue you generate, so this metric is of special importance.
Units Ordered
This shows the number of products customers have ordered from you. The volume of a product you sell is a major component of your product’s rank.
Orders Placed
These are the number of orders your customers have made in total. This is different from number of units, although they are often confused.
For example, if I were to order five of the same product from the same seller, there would be five units ordered and one order placed. The number of units comprises the order. In other words, an order placed is made up of units.
Product Sales Per Order
This number gives you the average amount of money you make per order. It is calculated by dividing your gross product sales by the total number of orders placed. So, if you sold 30 units of your product at two dollars per product (including extra costs) and accumulated three orders, then your product sales per order would be $60 divided by 3, or $20. This means, on average, your customers spent $20 on their orders.
Units Per Order
This calculation is the number of units sold divided by the number of orders. So, using the above example, if you sold 30 units and had 3 orders, then your units per order would be 10. So, on average, your customers purchased 10 of your items for each order placed.
Average Selling Price
Your average selling price is the sum of your product sales (including all extra fees such as gift wrapping and shipping costs) divided by the number of units ordered. So, if you sold a total of $200 worth of products and sold a total of 40 units, your average selling price is $200 divided by 40, or $5.
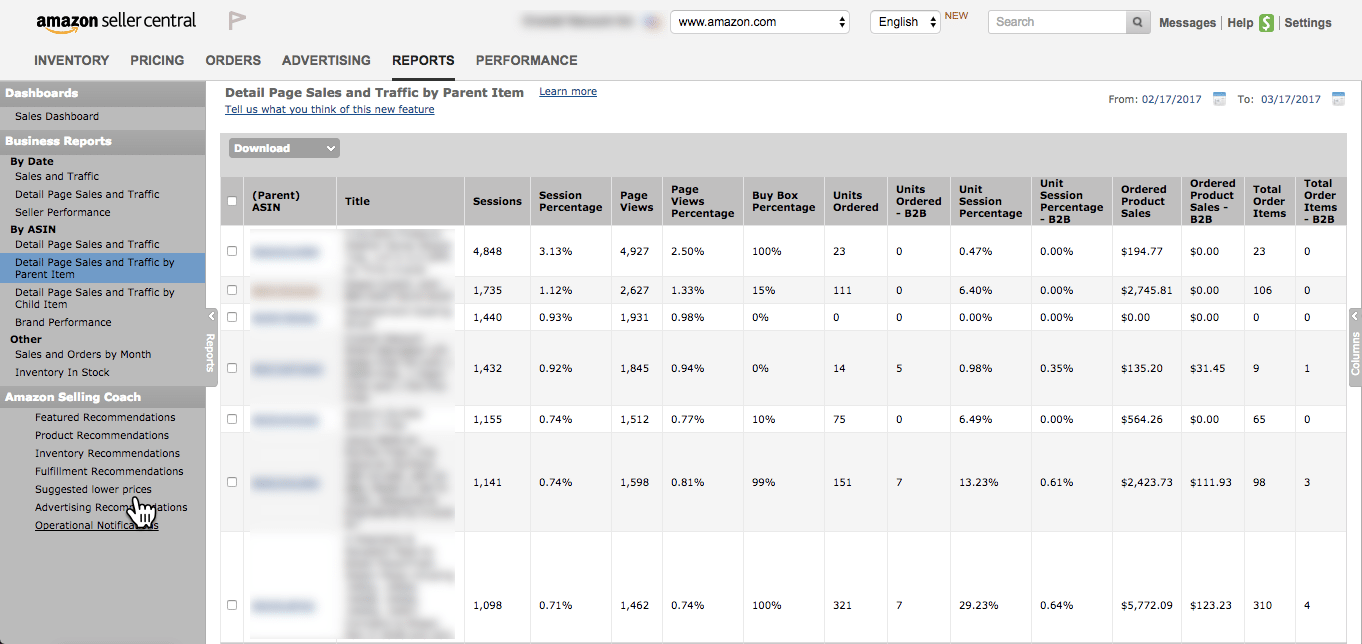
Page Views
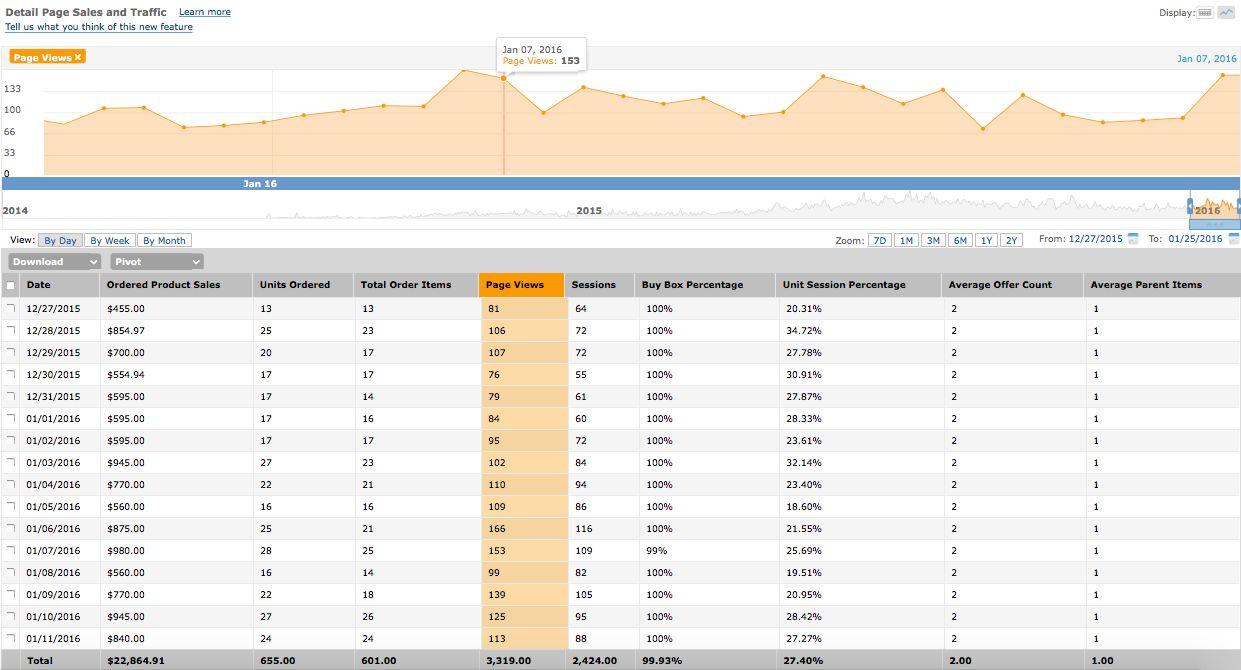
Page views are the number of visits your store's page garners. If a customer views several different pages within your store, these all go toward your total page views. Typically, more traffic means more conversions and more conversions translate directly into higher search and product ranking.
Sessions
The sessions metric can be a source of great consternation for Amazon sellers, so don't feel too bad if the idea of a session eludes you momentarily. Sessions track the number of times a user visits Amazon's site within a 24-hour period. This means that when a customer goes to Amazon, while they may visit dozens of pages, they have only racked up one session. Because of this, the number of sessions showing in your reports can be lower than page views.
Think of it like this: when a customer enters a physical store that can be thought of as a session. They may pick up items, read their labels, put some in their cart and place some back on the shelf. The number of items they picked up off the shelf can be thought of as page views. So although they may have viewed a handful of items (and therefore racked up page views), this all happened within one shopping trip (or one session).
If your pageviews are nearly the same as your number of sessions, this could actually be a bad sign. It may indicate that you are not sustaining the interest of the shopper. If they browse only one of your products and leave immediately, this could be a red flag that something, such as issues with your pricing strategy or product description, may be amiss.
Order Session Percentage
Your order session percentage is the number of orders placed divided by the number of unique sessions your store has tallied up. So let's say 50 customers visited your store, and in that time 5 of them placed orders. Then your order session percentage would be 5 divided by 50, or 10%. If your order session percentage is uncommonly low, it goes without saying that your product ranking will also suffer.
Average Offer Count
This is the average amount of offers displayed for sale on your page. Ideally you will have more than one offer going at any given time.
Buy Box
The Buy Box area is where customers engage with your product. Aptly named, it’s the box where users can add your item to your cart (i.e. the button that reads “Add to cart”). If you’re not the only seller providing a certain product, then you won’t necessarily have full control of the buy box. Your report will tell you how many of the orders made were completed with the buy box, and you may have to adjust your pricing strategy to help make up for your lack of control of the button.
How to Boost Your Amazon Placements
According to Amazon themselves, "Factors such as price, availability, selection, and sales history help determine where your product appears in a customer's search results. In general, better-selling products tend to be towards the beginning of the results list. As your sales of a product increase, so does your placement.” Page engagement is critical to your store’s ranking (perhaps more critical than the white whale product reviews have become).
You’ll need to study the information provided to you in the Sales and Traffic report, and supplement that knowledge with plenty of research and testing. While positioning your product and driving more engagement is clearly not an exact science, there are facts and figures we can use to more precisely drive our efforts.