
Let’s be honest – the main objective for any profitable retail business is to put products in the hands of customers and maintain customer satisfaction. The shorter your lead time and the faster you sell your inventory, the steadier your cash flow becomes. And more inbound money can not only be applied to your expenses, but it’ll help you cover labor costs, purchase additional inventory, and streamline inventory management processes in real-time.
A major way that ecommerce merchants keep track of what’s going on in their business is by monitoring a series of key performance indicators (KPIs) and comparing them to the same supply chain figures from previous time periods.
Monitoring, targeting, and controlling your sales and inventory KPIs creates strategic opportunities for ecommerce teams to uncover valuable insights, make informed business decisions, and discover the merchandising levers they can pull to drive measurable growth and improve their bottom line.
Manage your inventory with Extensiv
Here are 12 of the most important inventory management KPIs and their formulas for greater accuracy rates and stronger order fulfillment.
Sales KPIs
- Revenue % Contribution ($ Sls %)
- Unit Sales % Contribution (U Sls%)
- Percent Change (%▲)
- Sell Thru % (ST%)
Inventory KPIs
- Stock to Sales Ratio (Stk:Sls)
- Rate of Sale (ROS)
- Weeks of Supply (WOS)
- Open-To-Buy (OTB)
- Average Inventory (Avg Inv)
- Inventory Turnover Rate (ITR or “Turn”)
Return KPIs
- Return Rate by Price
- Return Rate by Units
Sales KPIs
The contribution of your sales that are attributed to each style, class, or department of goods you carry is important to understand. These numbers keep you informed about your inventory investments, as well as tracking how your entire inventory is balanced against your sales results. It is important to consider your sales contributions both from a revenue and unit sales perspective.
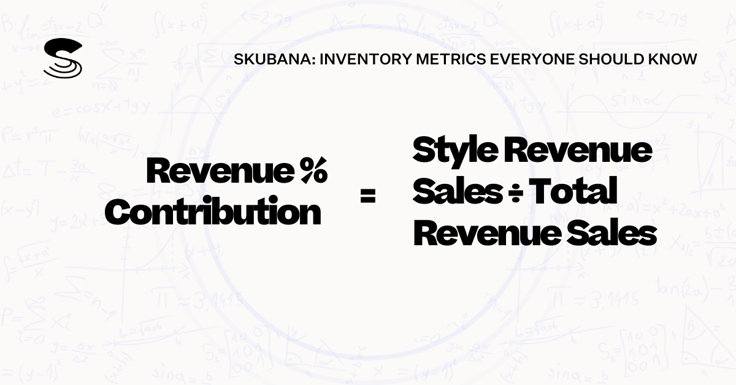
1. Revenue % Contribution ($ Sls %)
The percent of total revenue driven by a particular SKU, style, or department.
Formula: Revenue % Contribution = Style Revenue Sales divided by
Total Revenue Sales
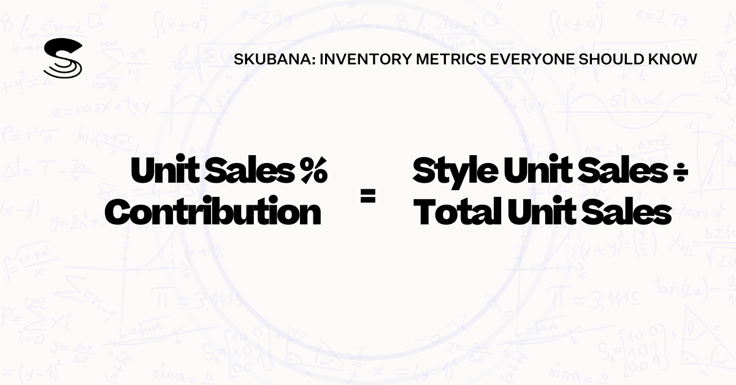
2. Unit Sales % Contribution (U Sls%)
The percent of total unit sales driven by a particular SKU, style, or department.
Formula: Unit Sales % Contribution = Style Unit Sales divided by Total Unit Sales
Understanding which products are driving your business is of paramount importance and these formulas should be present in every one of your sales reports.
Let’s say, for example, that you operate a women’s apparel brand that sells two product categories: Denim and T-Shirts. If you know that your unit sales are about 25% denim and 75% T-Shirts, then you would want your future inventory purchases to reflect this ratio.
Now, taking it a step further, in your T-shirt assortment, you have graphic tees and basic tees. You want to ensure that your investments in each of these subcategories is also balanced with your sales data. If your graphic tees make up 70% of your T-shirt sales, but only 50% of your T-shirt inventory, that is a signal that your buying strategy needs balancing.
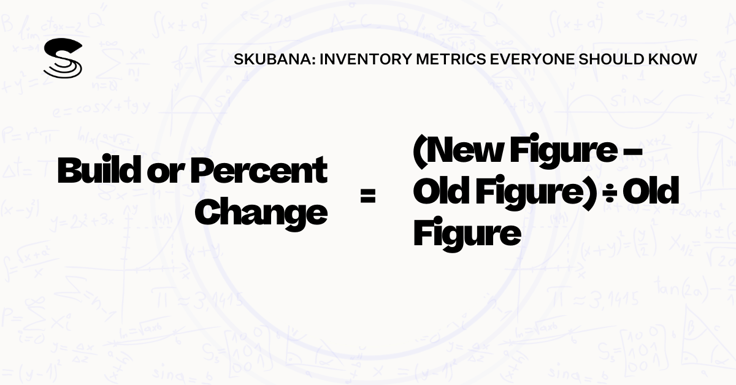
3. Build or Percent Change
Build is the percent change in any KPI relative to a previous period (Last year, last season, last quarter, last month, yesterday, etc). Use this calculation to see how your business changes over a designated amount of time.
Formula: Build or Percent Change = (New Figure – Old Figure) divided by Old Figure
For example, if you know your unit sales in denim are down -15% to last year, but you also notice your denim inventory is down -50% to last year, this could be why you’re seeing a reduction in the number of orders and less revenue in this department.
Do you need to expand your denim assortment? Do you need to increase your unit buys? These are the types of merchandising questions that Percent Change calculations can trigger.
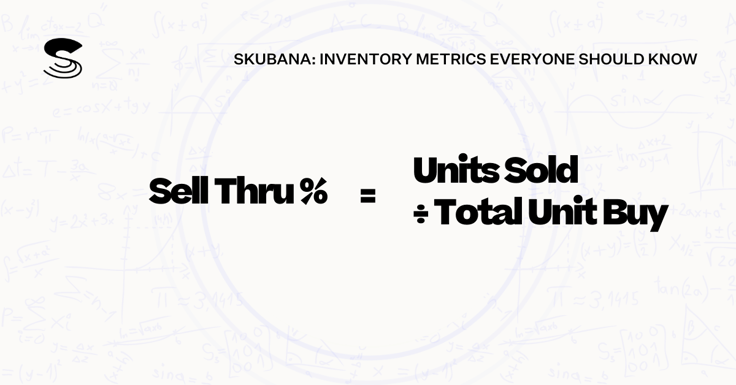
4. Sell Thru % (ST%)
The sell through percent is your total unit sales divided by the total unit buy. This helps you understand what percent of your available inventory has sold over a specified period.
Formula: Sell Thru % = Units Sold divided by Total Unit Buy
For seasonal (short-term) products, you should target a sell thru rate of 100% for the anticipated selling period. This means you ‘run out’ of the product on purpose, since you don’t plan to reorder it.

For seasonless (long-term) products that can be sold all year, you should target a sell thru rate of about 70% between purchasing cycles. This will ensure that towards the end of the season, you’ll still have enough physical inventory to fulfill a range of customer orders before needing replenishment.
Inventory Management & SKU KPIs
In this next section, we’ll focus on KPIs that directly relate to your inventory flow. These metrics are useful to inform decisions like how to improve cost efficiency and inventory turnover ratio.
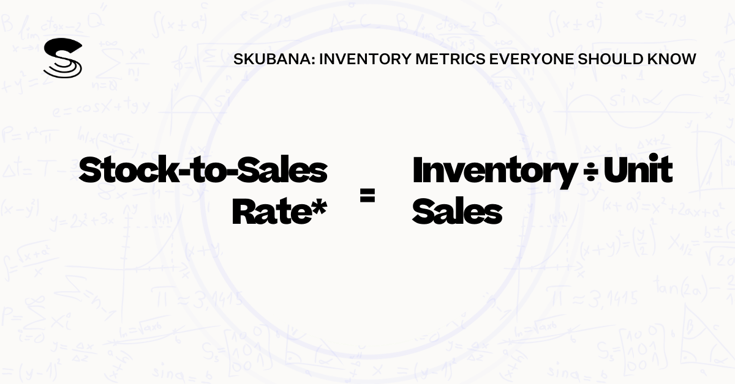
5. Stock-to-Sales Ratio aka "Inventory-to-sales Ratio" (Stk:Sls)
The proportion between the inventory levels and the unit sales for the same period. This figure can be expressed as a rate or as a ratio.
Formulas:
Stock to Sales Rate = Inventory divided by Unit Sales
Stock to Sales Ratio = Inventory Contribution% divided by Unit Sales Contribution%
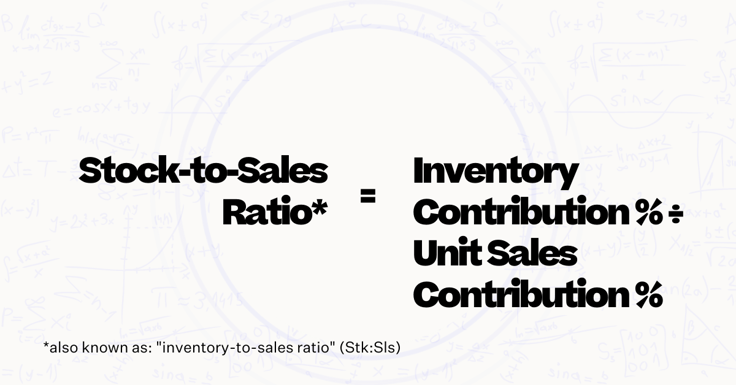
This is where your unit sales contribution comes in handy. Your goal is for the stock levels of a particular item to make up as much of your total inventory as it ultimately contributes to your sales, with the perfect score being 1 (or 1:1 expressed as a ratio). This means you own exactly as much inventory as you can sell – not more (excess inventory) and not less (stock-outs).
PRO TIP: It can also be useful to calculate this using your $ Sales Contribution, as it may identify products that are more productive in gross margin dollars than they are in unit sales
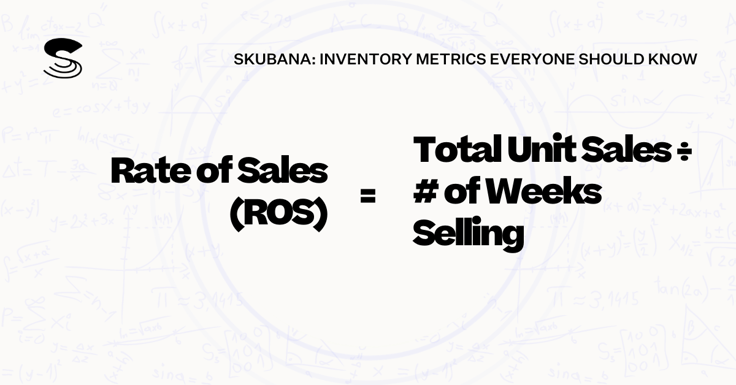
6. Rate of Sale (ROS)
The average number of units sold per week of a particular SKU, style, or department over a specified period of time. This is a simple figure that helps you easily compare how quickly various products are selling per week and calculate the rate of return you’re getting on each product.
Formula: Rate Of Sale = Total Unit Sales divided by # of Weeks Selling
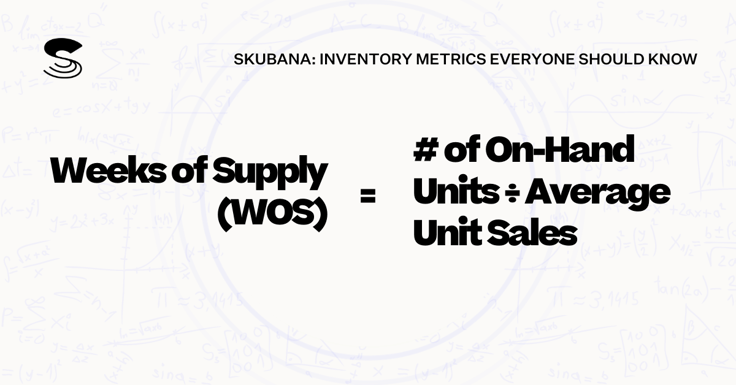
7. Weeks of Supply (WOS)
Weeks of supply is calculated as the number of on-hand inventory units for a given period divided by the average unit sales for that same time frame. This helps you understand how many weeks of sales could be sustained before you run out of inventory.
Formula: Weeks Of Supply = # of On-Hand Units divided by Average Unit Sales
8. Open-To-Buy (OTB)
Open-To-Buy planning is a very important part of the retail buying process. This critical step gives you a full view of current on-hand inventory, all upcoming receipts, and accounts for expected sales through the replenishment date in question.
Formula: Open-To-Buy = (Planned Beginning Inventory - (On-Hand Inventory + Upcoming Receipts) - Planned Unit Sales)
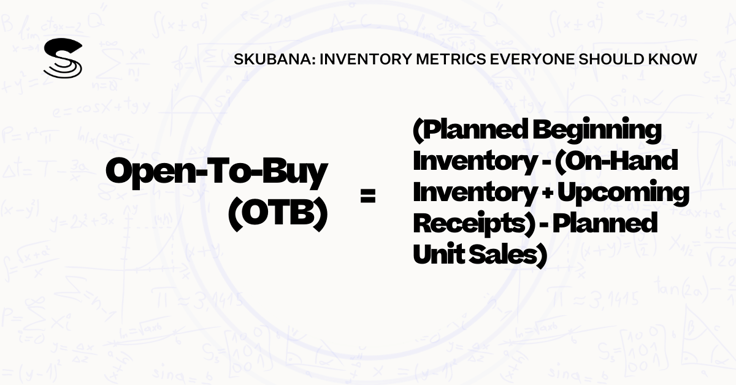
Your open-to-buy tells you how much room there is to buy additional inventory for a specified future season, which can prevent overbuying. It is a good rule of thumb to allocate your OTB by category proportionally to your most recent unit sales contributions for each category.
9. Average Inventory (Avg Inv)
This is the average amount of inventory available in stock during a given period.
Formula: Average Inventory = (On-Hand Inventory + Beginning Inventory) divided by 2
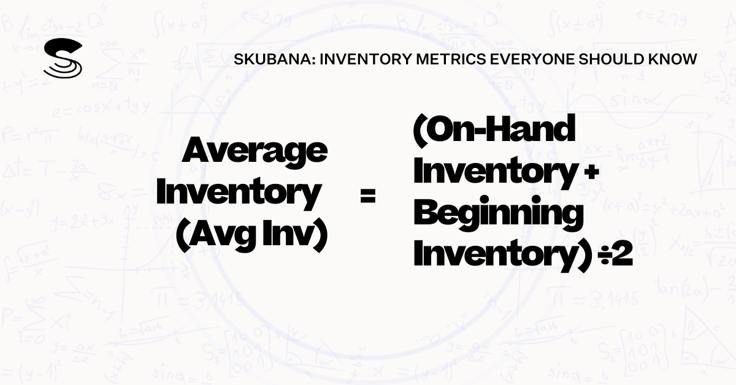
For example, let’s say that your beginning of period (BOP) inventory balance was 20,000 units, and the current on-hand inventory balance is 50,000 units. The average inventory is 20,000 + 50,000 = 70,000, then divide that by 2, and your average inventory is 35,000 units.
This figure, when compared to your unit sales for the same period, will make you more aware of your average open-to-buy, and help you calculate carrying costs and identify imbalances between your investments and sales results.
10. Inventory Turnover Rate (ITR or "Turn")
Last, but certainly not least: the Inventory Turnover Rate (ITR or "Turn") measures how much time elapses between when your physical inventory is purchased and when it is sold, and it is a measure of how well you sell the inventory you purchase.
To calculate your annual inventory turnover rate, divide the annual cost of goods sold by the average inventory (at cost value) for the same year. This tells you how many times you purchased and sold your inventory in a year.
Formula: Inventory Turnover Rate = Cost of Goods Sold divided by Average Inventory Value
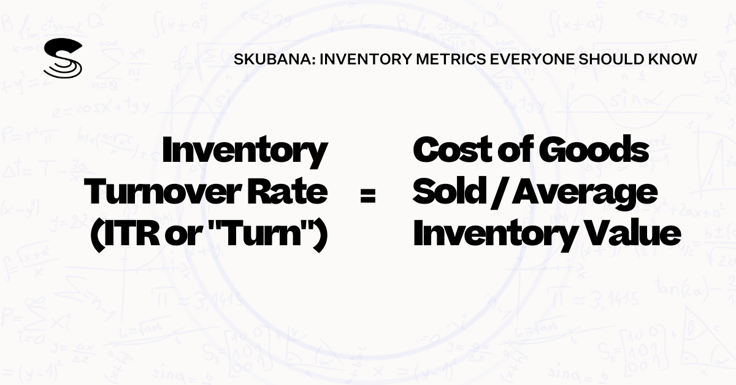
For example, if your COGS for a year totaled $500,000 and the average value of your inventory was $120,000, your “turn” would be 4.1. This rate means you replenished your inventory roughly 4x per year, or about every 3 months.
Knowing your inventory turnover rate is crucial to forecasting demand: you don’t want your turn to be too high, as you’ll risk over-buying an item that may be down-trending, or missing sales due to having fringe inventory at the end of a replenishment cycle. However, you also don’t want it to be so low that you have inventory sitting for long periods in backstock (or worse, winding up in dead stock).

For businesses in most industries, a good turn rate is between 4 and 10. This rate specifies you sell and replenish your inventory every 1-3 months, which is important to consider as you make supply chain decisions, forecast your unit sales, and anticipate the average time for putaway or general warehousing duties.
To learn more about what ITR might be right for your business, check out What is a good Inventory Turnover Rate by Skubana.
The key is to have better inventory control, by finding the sweet spot between your unit buys and buying frequency. That way, you buy almost exactly as many units as you’ll need to satisfy the sales forecast until the next replenishment arrives from your storage space.
Product Return KPIs
Returns are more than a lost sale. Returns have an impact both on your final sales figures and your inventory balance sheet. The cost of shipping and processing returned items and can easily diminish the profits earned from other sales, especially if the product has been used or damaged. We've added two bonus KPIs to help you better understand your return rate.
11. Returns by Price
Formula: Return Rate by Price = Price Return divided by Price Paid-png-1-4.png?width=736&name=Formulas%20(1)-png-1-4.png)
12. Returns by Unit
Formula: Return Rate by Units = Units Ordered divided by Units Returned.
-png-1-4.png?width=736&name=Formulas%20(2)-png-1-4.png)
How to Use Inventory Management KPIs To Make Decisions

Ultimately, these sales and inventory management KPIs help guide you as you make decisions that relate to the 4P’s of merchandising.
The 4P’s are the different levers that a decision-maker can pull to affect changes in their retail business:
- Product
- Price
- Promotion
- Placement
Merchants have important decisions to make about what Products to sell; what Price to sell them for; how to Promote those products; and in what setting - in marketing, online, and in physical retail spaces - to strategically Place those products.
Many of your merchandise planning decisions act as a switch; a catalyst or an inhibitor in your merchandising operation that you can turn on or off strategically to drive sales.
Decrease inventory supply ⏭ unit sales will slow down
Increase the retail price ⏭ unit sales will slow down
Divest in a product ⏭ shift into more productive products
Run a 30% OFF promotion ⏭ to accelerate your unit sales velocity
Increase marketing spend ⏭ drive more unit sales
Going back to our women’s apparel brand example, if you know that your denim accounts for 40% of your total inventory units, but only 25% of your total unit sales, then your Stock:Sales Ratio is 40:25 (or expressed as a rate, 1.6). We know that this is an imbalance, as it is far from a 1:1 ratio. This imbalance should trigger your Spidey senses…
You have a merchandising lever to pull!
You should decrease your unit buy on denim, and increase your unit buy on T-shirts.
Do you need to reevaluate your Open-to-Buy? This may be a time to dig a little deeper: what is the Percent Change between your denim sales contribution this year versus last year?
Take things a step further by diving into your T-shirt assortment.
Perform your calculations:
- What is your Stock:Sales ratio for graphic tees vs. basic tees?
- Is there an imbalance? Can you correct it?
- Is there a high sell-thru rate on some products and not others?
- What styles have the highest Rate Of Sale and Inventory Turnover Rate?
- Can you shift your investments slightly (or completely) out of underperforming SKUs?
- Is one of your sales channels doing better with certain styles than others?
This art of asking questions and observing the relationships between your sales and inventory metrics is called class positioning. Analyze each product category or style to identify opportunities to tweak your retail purchasing strategy. Getting into the habit of making well-informed decisions will result in increased unit sales, greater profit margin, and hopefully, more consistent and on-time deliveries for a perfect order every time.
Constantly looking at your business needs from multiple angles, through multiple lenses to find the hidden insights that will drive your business is the very essence of the merchandising function.
Fortunately, there are a lot of ecommerce automations and inventory management systems out there that can make easy work of building out the reports you need. It’s on you to analyze those data points, digging out the insights that’ll help streamline your decision-making, determine your order cycle time, and boost your rate of order fulfillment.
How Metric-Based Decisions Impact Your Bottom Line

Every decision-maker of an ecommerce business – especially whoever manages purchasing and oversees inventory accuracy - needs to understand the merchandising levers that can be strategically pulled to improve your business profitability and support customer satisfaction.
Regular, real-time reporting and analysis of your sales, KPIs, and inventory management processes will result in a holistic understanding of what is (and what isn't) driving your business in the right direction. If you don't have the chops for digging into sales data or warehouse KPIs, don't worry, you can learn (and having solid inventory management software can help in this regard as well).
For these retail formulas, and more, check out the Ecommerce KPI Cheat Sheet (downloadable).
If you're interested in getting help learning the math behind your online business, FOMO agency™ is here to help. Whether you’re a warehouse manager, a new small business owner, or a seasoned ecommerce store with hundreds of SKUs and product categories, our team of experienced retail and ecommerce consultants can help you with a variety of merchandising and automation needs.
Be the first to know
Subscribe to our newsletter


