![Ecommerce KPIs: Metrics To Track, Measure, & Report On [2022]](https://20995814.fs1.hubspotusercontent-na1.net/hub/20995814/hubfs/Skubana/Blog%20Pages/Imported_Blog_Media/KPI%20Analytics%20Dashboard%20With%20Graphs-4.jpg?upsize=true&upscale=true&width=1200&height=800&name=KPI%20Analytics%20Dashboard%20With%20Graphs-4.jpg)
Ecommerce key performance indicators (KPIs) are measurable values that demonstrate how effectively a company is achieving its key objectives at different levels of the organization.
Figuring out what you want (or need) to measure begins with clearly stating your business goals. Whether you’re trying to boost sales, streamline marketing, or improve customer service, you’ll need a clear vision of where you’re headed before you can properly implement any KPIs.

In this article, we’ll take a closer look at ecommerce KPIs from the vantage point of marketing, sales, and customer success. Plus, we’ll share some insights on the best tools to measure your KPIs that’ll fuel your brand’s growth and long-term success.
What Are Ecommerce KPIs?
Ecommerce KPIs are used to measure the success of your online brand. These metrics can track your sales, monitor your marketing efforts, and gauge the overall effectiveness of your ecommerce store. Although there are tons of KPIs you can choose from, most merchants work with a few benchmarks that are best aligned with their business objectives.
In many ways, ecommerce KPIs are a gateway to determining product or brand performance — seeing as they reveal whether your day-to-day operations are moving in the right direction to reach your goals. By prioritizing (and analyzing) ecommerce metrics, your company can better understand its data and gather important insights to spur your growth.
That’s because KPIs pinpoint exactly what’s going well and what’s going wrong for your brand. You can then use this information to make adjustments to your business model, or to educate your sales, marketing, and operations teams on where they have room to improve.
Marketing KPIs for Ecommerce

Even if you have a quality product that’s unique from the competition, that product isn’t going to sell unless customers know about your brand. That’s why it’s so necessary to drive visitors to your website, since this is the first step in increasing customer conversions.
Some of the best ways to get more eyes on your site include: search engine optimization (SEO), social media engagement, email campaigns, and paid ads/sponsored posts. But even after you’ve made these moves, you’ll still need a process for measuring the impact of your digital marketing — which is where marketing KPIs can really come in handy.
The following are some of the most popular marketing KPIs for ecommerce, used to determine whether your marketing strategies are working to your advantage. This way, you can replicate your successes, adjust your failures, and achieve the sustainable growth you deserve.
Website traffic
Website traffic is the total number of people who visit your ecommerce site. Generally speaking, the more site traffic you have, the more likely you are to turn those visitors into paying customers. But not only does more traffic lead to more purchases, it also boosts brand awareness and helps customers remember your name (so they can mention it to their friends).
Under the umbrella of website traffic metrics, your company can track: total visits, unique visitors, returning visitors, and demographics like physical location or socioeconomic status.
Average session duration
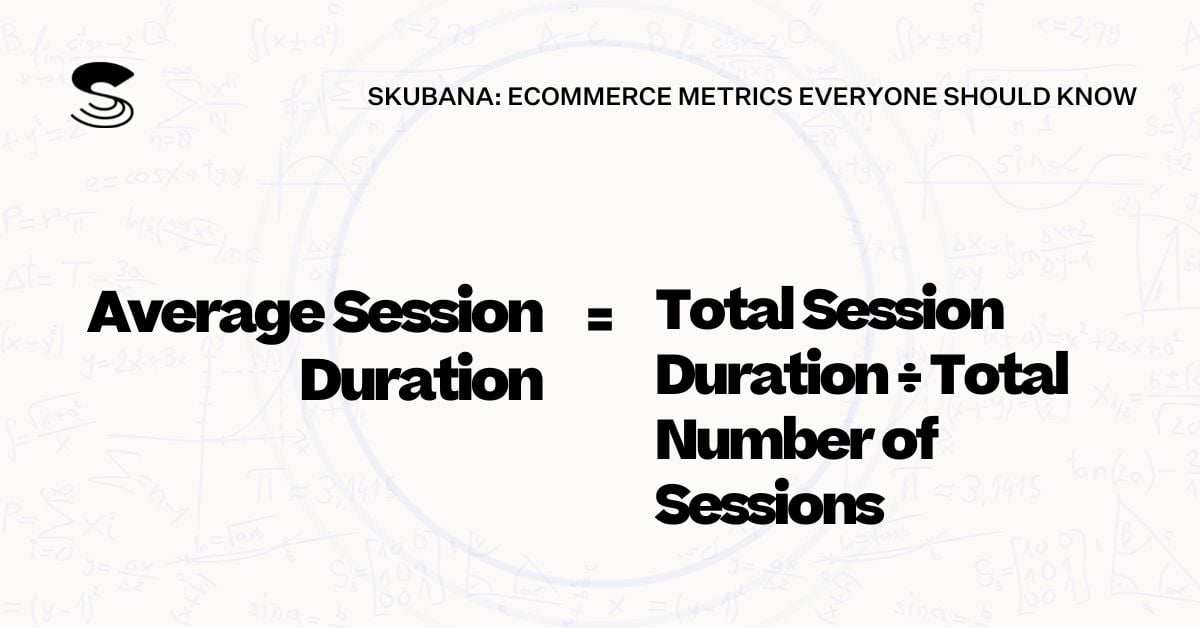
Average session duration is how long visitors usually stay on your website. In other words, it’s the average amount of time someone spends on your site during a single visit. This metric is a great reflection of user engagement, and can illustrate whether new and returning visitors are interested in your site content. To calculate average session duration, use the formula:
average session duration = total session duration / total number of sessions
Page views per session
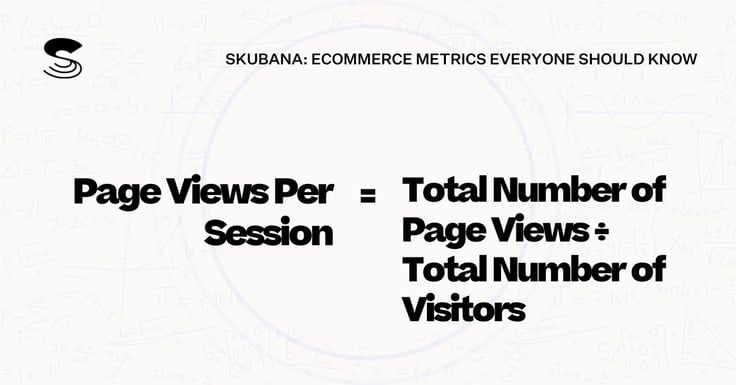
Page views per session is the number of pages someone visits each time they’re on your site. Keep in mind, higher page views can indicate it takes customers a lot of clicks to find what they’re looking for. In this case, you might consider revamping your ecommerce website to offer a more seamless user experience. To calculate page views per session, use the formula:
page views per session = total number of page views / total number of visitors
Bounce rate
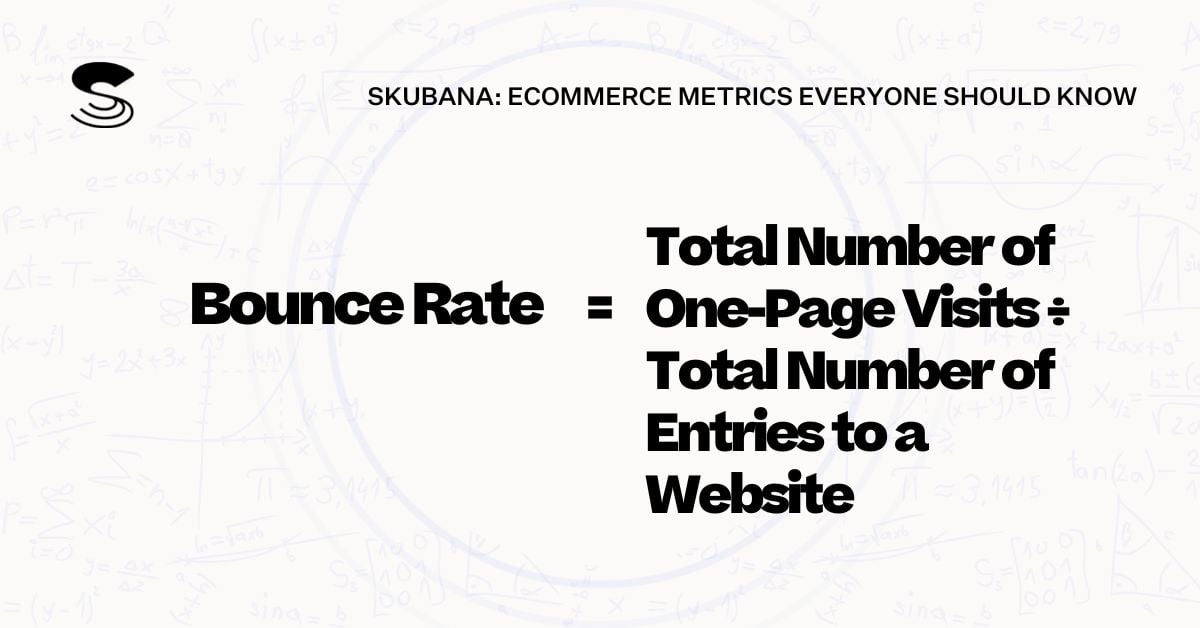
Bounce rate tells you how many visitors leave your site after arriving from a search engine, referral source, or another website. Typically, these visitors leave after viewing just one page or before they’ve taken any action (like clicking a link or making a purchase). With that in mind, you’ll want to keep this metric as low as possible. To calculate bounce rate, use the formula:
bounce rate = total number of one-page visits / total number of entries to a website
Pay-per-click (PPC)
Pay-per-click (PPC) is an online marketing strategy where companies pay a fee every time one of their ads is clicked. Basically, PPC is a way to buy site visits rather than earning those visitors through an organic search. Measuring PPC shows you how much you’re spending on each click so you can decide whether the ad spend is actually worth it. To calculate PPC, use the formula:
pay-per-click = total advertising costs / total number of ads clicked
Cost per conversion (CPC)
Cost per conversion (CPC) is used to show the costs associated with achieving a sale. That is, it’s the amount you pay to turn a visitor into a buyer — or the total advertising costs (and product placement expenditures) that drive a successful conversion. Many online retailers use this KPI to inform how they price products or what they pay for ads. To calculate CPC, use the formula:
cost per conversion = total cost for generating traffic / total number of conversions
Email conversion rate
Email conversion rate is the percentage of subscribers who complete a purchase on your website by clicking through the links included in your email campaigns. This KPI is a great indication of the effectiveness (and profitability) of your email marketing, as well as the overall return on investment from your email list. To calculate email conversion rate, use the formula:
email conversion rate = (total number of conversions from emails / total number of emails delivered) x 100
Social media engagement
Social media engagement refers to the number of fans and followers who are interacting with your brand on various social media outlets. You can measure your engagement via the number of likes, comments, or new followers you’ve gained. If engagement is low, you may want to revise your social media marketing or introduce new content to reach a broader audience.
Sales KPIs for Ecommerce

If you’re keeping tabs on your marketing metrics and making improvements where needed, then there’s a good chance your hard work will pay off — meaning you’ll see a big increase in sales. And when this happens, you’ll need a reliable way to track and understand your sales data so you can scale your business even further. Fortunately, sales KPIs do exactly that.
Sales KPIs measure the success of relevant sales activities within your company. More specifically, these KPIs help to optimize your sales performance, sales funnel, and sales cycle length so you can maximize your profits and keep your cash flow flowing. The following are some of the most popular sales KPIs for ecommerce, used to determine whether your sales are on an upward trajectory or whether they’re in need of some extra attention.
Average order value (AOV)
Average order value (AOV) is the average dollar amount of each order on your website or mobile app. In short, AOV is the average amount of money customers spend on a single order. Using AOV gives you an idea of how much revenue each customer generates, so you can offset customer acquisition costs (CAC) and increase your ROI. To calculate AOV, use the formula:
average order value = total revenue / total number of orders
Customer lifetime value (CLV)
Customer lifetime value (CLV) tells you what each customer is worth to your business; CLV is how much your company can expect to earn (on average) from the lifetime spend of a customer. This is an important metric for your financial viability, since a high CLV implies customer loyalty and recurring revenue from your (existing) customer base. To calculate CLV, use the formula:
customer lifetime value = (customer’s annual profit contribution x average customer lifespan) – initial cost of customer acquisition
Conversion rate
Conversion rate is the percentage of online visitors who convert into paying customers. A high conversion rate shows that you’ve convinced a lot of visitors to spend money on your products, while a low conversion rate indicates your visitors aren’t ready to buy yet — or perhaps your marketing isn’t tailored to your target audience. To calculate conversion rate, use the formula:
conversion rate = (total number of website visitors / total number of conversions) x 100
Churn rate
Churn rate is the percentage of customers who stop spending money with your ecommerce business. This is an especially important KPI for online retailers who operate on a subscription basis, like with Amazon Subscribe. Essentially, churn rate lets you know the pace at which customers are clicking ‘unsubscribe.’ To calculate churn rate, use the formula:
churn rate = (number of churned customers over a set time period / total number of customers at the start of that period) x 100
Shopping cart abandonment rate (CAR)
Shopping cart abandonment rate (CAR) is the percentage of shoppers who add products to an online cart or basket, but then never follow through to complete their purchase. Many times, customers abandon their cart due to the cost of your products, the cost of shipping, or because the checkout process is too time-consuming/complicated. To calculate CAR, use the formula:
shopping cart abandonment rate = (total number of completed transactions / total number of shopping carts) x 100
Cost of goods sold (COGS)
Cost of goods sold (COGS) is all the direct costs you have to spend to sell your product — like manufacturing fees, employee wages, and overhead expenses. Simply put, COGS is a critical KPI because it shows exactly how much you’re spending to sell your inventory; a higher cost of goods is usually associated with lower profit margins. To calculate COGS, use the formula:
cost of goods sold = (beginning inventory + purchases inventory) – ending inventory
Inventory turnover
Inventory turnover is a financial ratio that shows you how many times your company has sold and replaced its inventory over a designated time period (like over the course of a year). With the help of inventory turnover, your brand can see whether it’s storing excess inventory and then map out its next purchasing decisions. To calculate inventory turnover, use the formula:
inventory turnover = total cost of goods sold / average inventory value
Average profit margin
Average profit margin represents your typical profit margins over a specified period of time. Ideally, your average profit margin would increase at the same time your sales ramp up. By paying attention to your average margins, you can see just how much of every revenue dollar is flowing to your bottom line. To calculate average profit margin, use the formula:
average profit margin = gross profit / revenue
Customer Success KPIs for Ecommerce

Even when your marketing is doing its job and your sales are steadily rising, you’ll still need a pulse on how customers are relating to (or experiencing) your brand. To get a good read on your customers’ preferences and perspective, you’ll need assistance from customer success KPIs for ecommerce. These metrics give you a detailed view of the customer experience/buyer journey — which you can leverage to boost your customer retention rates and understand retention analysis.
Both marketers and managers can use customer success metrics to gain critical insights into areas like customer satisfaction, return rate, and monthly recurring revenue. In essence, these KPIs are all about turning shoppers into repeat customers with increased spend per purchase. The following are some of the most popular customer KPIs for modern ecommerce.
Customer satisfaction (CSAT) score
A customer satisfaction (CSAT) score measures customer approval of your online business or a previous purchase. The CSAT score is one of the easiest metrics to collect. In fact, it’s often obtained by asking customers a single question: “How satisfied were you with your experience?” These answers are recorded on a numeric scale of 1 to 5 (or 1 to 10), with higher numbers indicating strong satisfaction, and lower numbers a sign that your company has work to do.
Net promoter score (NPS)
A net promoter score (NPS) measures customer experience of your brand. Like CSAT, a net promoter survey asks customers a single question: “On a scale of 1 to 10, how likely are you to recommend our product or service?” You can use this information to figure out where customers are encountering confusion or frustration with your site. When you eliminate all the reasons why someone wouldn’t recommend your brand, customer satisfaction will inevitably increase.
Average revenue per user (ARPU)
-4.jpg?width=1200&name=Average%20Revenue%20Per%20User%20(ARPU)-4.jpg)
Average revenue per user (ARPU) measures the earnings generated per user or subscriber. In other words, ARPU can show you which products/business segments are performing the best (versus which are performing the worst). This metric allows brands to better understand their customers and compare their numbers to the competition. To calculate ARPU, use the formula:
average revenue per user = total revenue generated / total number of active users
Monthly recurring revenue (MRR)
-4.jpg?width=1200&name=Monthly%20Recurring%20Revenue%20(MRR)-4.jpg)
Monthly recurring revenue (MRR) is the predictable revenue you bring in on a monthly basis. More specifically, it’s all the active subscriptions in a particular month — like recurring charges from discounts or coupons. In general, you can assume that the more recurring revenue you have, the happier customers are with your product. To calculate MRR, use the formula:
monthly recurring revenue = ARPU per month x total number of active users per month
Expansion revenue
Expansion revenue is the opposite of churn; it measures how much of your profits come from existing customers. This way, you can see how successful you are at upselling to your customer base. Although acquiring new customers gets a lot of attention, it’s actually more profitable to generate revenue from existing clientele. To calculate expansion revenue, use the formula:
expansion revenue = sum total of MRR from cross-sells and upsells – new revenue from recently acquired customers
Net dollar retention (NDR)
-4.jpg?width=1200&name=Net%20Dollar%20Retention%20(NDR)-4.jpg)
Net dollar retention (NDR) calculates the revenue change triggered by your existing customers. This metric shows you how much your recurring revenue has grown or shrunk over time — based on upgrades, downgrades, or negative churn. Put another way, NDR looks at how much money you’ve lost or gained from repeat customers. To calculate NDR, use the formula:
net dollar retention = [(starting MRR + expansion) – churn)] / starting MRR
Return rate (RR)
Return rate (RR) is how often customers return items to your online store. An ecommerce return rate is represented as a percentage of the total number of products you sold within a designated time frame. If your return rate is high, it’s a sign your company didn’t meet its customers’ expectations on product quality, price, sizing, etc. To calculate return rate, use the formula:
return rate = (total number of return items / total number of items sold) x 100
Customer support tickets
Customer support tickets are a record of the interactions between your customers and your customer experience team. When people call or email your company with their concerns, a new ticket is opened while a customer service representative works to resolve the issue. If you have a high number of customer support tickets, it can reveal pain points within the buyer journey.
Tools to Measure Your KPIs
The majority of the marketing, sales, and customer success KPIs we’ve mentioned can be gathered from site analytics tools like Google Analytics or Yoast; marketing automation platforms like Hubspot; email service providers like Mailchimp; or from your own inventory or order management infrastructure. You can use the data collected to streamline decisions about your purchasing process, product performance, and conversion rate optimization.
In addition, you should pay special attention to when/where your data reveals:
- A sudden increase in bounce rate on your site, which means your website is moving slower than normal or customers are running into dead links.
- A decrease in your monthly orders, which lets you know that your marketing campaigns aren’t affecting your sales or driving leads to your site.
- A lower conversion rate, which means your landing pages or site design are making it difficult for customers to complete tasks (like finalizing their purchase).
- An increase in your pay-per-click, which means you might not be utilizing the appropriate keywords in your ads or on your website.
Each of these bulleted points represents an opportunity for your company to make adjustments to better serve your customers. But remember, data from inventory metrics can only take you so far; it’ll be up to you to transform this information into tangible results.
Pulling It All Together
While there are tons of ecommerce KPIs available to you, there’s no reason you have to implement them all. Instead, choose a few KPIs from each category — marketing, sales, and customer success — to give you a well-rounded, real-time look at your retail operations.
When you implement KPIs that meet your needs and reflect your goals, these metrics can actually be leveraged to convert more customers and generate higher profits. For example:
- Boost sales 10% in the next quarter by using conversion rate and website traffic.
- Reduce lost sales (due to stockouts) by 50% when you use inventory turnover.
- Increase conversion by 2% in the next year with the help of cart abandonment rate.
- Reduce customer service calls by half by incorporating customer satisfaction surveys.
Keep in mind, ecommerce success is a data-driven entity that is in a constant state of flux and fine-tuning. Ecommerce professionals must not only stay on top of their business — but they must also be aware of the numbers that make up the essence of their business.
When you measure site visitors, cart abandonment, and conversion KPIs, know that you’re putting your company on the fast track toward achieving its goals in no time at all.